What 632,937 Formula 1 laps say about cars, drivers and strategy

This report uses every race lap recorded in Formula 1 from 1996 to September 2026: one row for each lap by each driver, across 583 races, 147 drivers and 45 teams. Comparing every lap with the rest of the field on that same lap shows that the car explains about 83% of the differences in race pace and the driver about 4%. Since refuelling ended, pitting before the car ahead wins the place 46.5% of the time, the pole-sitter leads 55% of all laps, and cars break down about a tenth as often as they did in 1996. A model that sees only pre-race information puts 69% of podium finishers in its top three, barely more than the starting grid alone.

Headline numbers1996 to 2026
Laps analysed583 races, 31 seasons
632,937
Race pace explained by the carthe driver explains 4.4%
82.9%
Laps led by the pole-sittershare of all 35,546 laps led
55.0%
Undercuts that win the placepitting second wins 21.8% (2010 to 2026)
46.5%
Mechanical retirements per 1,000 laps1996, then 2025
6.24 to 0.60
Podium places the model picks correctly306 races it never trained on
68.8%
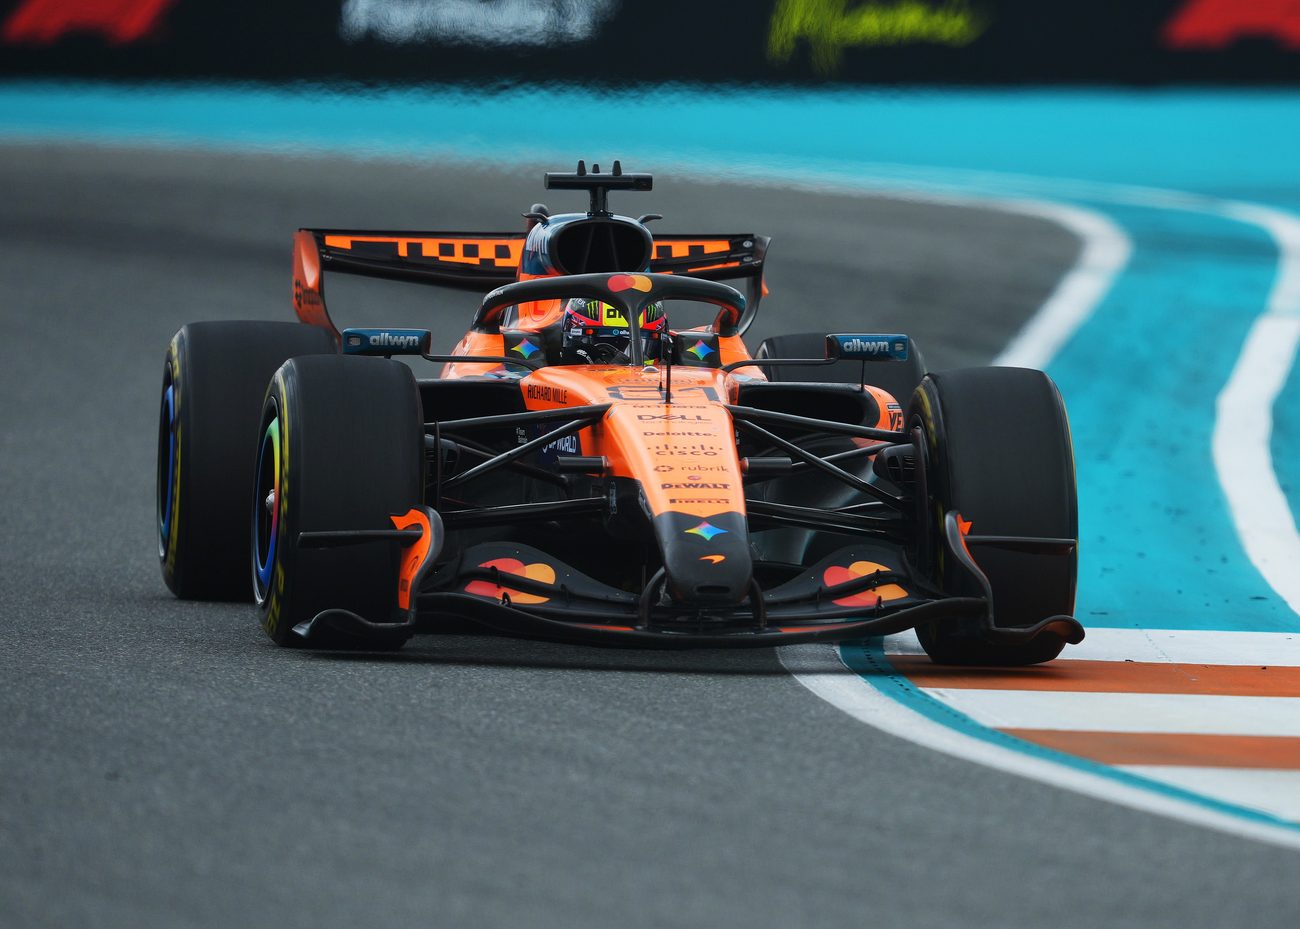
A Formula 1 car seen head-on as it takes a corner, the driver's helmet visible above the nose. Black-and-white photograph of a driver in silhouette walking down a corridor toward the light.

Car and driver

How much of a result is the machine, and how much is the person in it.

The car accounts for 83% of race pace differences, the driver for 4%

For every driver in every race I take the median gap between their lap times and the field's median lap time on the same lap. Two teammates share a car, so the gap between them cannot be the car. Across 5,157 teammate pairings in 582 races, that logic splits the variance in race pace into three parts: 82.9% between cars, 4.4% from lasting differences between teammates, and 12.7% from race-to-race noise such as traffic, damage and strategy.

In lap time terms, one standard deviation of car is 1.11% of a lap, about 1.00 seconds on a 90-second lap. One standard deviation of driver is 0.26%, about 0.23 seconds. The driver share is largest in the 2022 to 2025 ground-effect era, at 8.9%, because the cars were closer together (finding six), not because drivers changed.

Where race pace differences come from

Share of the variance in race pace, all seasons and by rules era

The 2026 season is included in the all-seasons bar but has too few races for its own. Method in the closing section.

Measured only against teammates, Max Verstappen is the fastest driver since 1996

Raw results reward whoever has the best car. To take the car out, I rate drivers using only the pace gap to a teammate in the same race, then chain the comparisons together: if A beat B in one team and B beat C in another, that says something about A and C. Each rating is the driver's pace advantage over an average teammate, with drivers who have few comparisons pulled toward zero.

Max Verstappen comes out 0.79% per lap faster than an average teammate, about 0.71 seconds on a 90-second lap, and 0.20 percentage points clear of Charles Leclerc in second (0.59%). Fernando Alonso is third at 0.56%. Behind the leader the intervals overlap heavily, so the order from second to tenth is not settled by this data. The chart shows the top 15 of the 53 drivers with at least 60 teammate comparisons.

Pace advantage over an average teammate

Percent of lap time, with 95% intervals from re-sampling races

A rating is one number for a whole career since 1996, so it averages over a driver's best and worst years.

A red Formula 1 car spinning its rear tyres, half hidden in a cloud of tyre smoke.

Strategy

What fuel, tyres and the timing of a pit stop are worth.

A lap of fuel burn is worth 0.057 seconds; a lap of tyre wear costs 0.036

Since refuelling was banned in 2010, a car only gets lighter during a race while its tyres are reset at every stop. That lets a regression separate the two effects. Using 317,668 green-flag laps from 2010 on, and comparing each driver only with their own laps in the same race, lap times fall by 0.063% for every lap of the race completed and rise by 0.039% for every lap since the last stop. On a 90.8-second lap that is 0.057 seconds gained and 0.036 seconds lost.

The first figure also includes the track gaining grip as rubber goes down, which this data cannot separate from fuel. Tyre wear was steepest in the ground-effect era: 0.048% per lap in 2022 to 2025 against 0.031% in 2010 to 2013. With the fuel trend removed, a tyre that has done 20 laps is 0.64% slower than one that has done two, about 0.58 seconds.

Lap time lost as tyres age, with the fuel effect removed

Percent slower than the second lap of the stint, 2010 to 2026

The curve flattens partly because only hard, durable tyres are kept on for 30 laps or more.

Pitting first now wins the place 46.5% of the time. With refuelling, pitting second won.

I found every case of two cars running nose to tail, the second within three seconds of the first, where one pitted and the other followed within three laps. One lap after the second stop, who was ahead? From 2010 on, the chasing car got ahead in 46.5% of 914 cases when it pitted first (the undercut) and in 21.8% of 1,013 cases when it pitted second (the overcut). When neither car stopped, the chaser got by within four laps 15.1% of the time.

In the refuelling years of 1996 to 2009 the order was reversed: the overcut worked 56.4% of the time and the undercut 30.7%. A car that stayed out was running light on fuel while its rival rejoined heavy. Today's fresh-tyre advantage decides it instead. Teams choose when to try these moves, so the rates describe attempts that were made, not what would happen at random.

How often the chasing car ends up ahead

Percent of cases, by who pitted first and by refuelling period

Since 2010, starting within one second: undercut 66.2%, overcut 32.7%, no stop 25.5%.

Rule changes set the number of stops: 2.7 a race in 2004, 1.4 in 2018

The number of pit stops a finisher makes follows the rule book more than anything teams decide. In 2004, with refuelling and short fuel stints, 68.2% of finishers stopped three times or more. In 2010, the first season without refuelling, 68.3% stopped once or not at all. A year later a new tyre supplier brought tyres built to wear out, and that share fell to 2.9%.

The one-stop race returned by 2018 (65.1% of finishers) and has stayed common: finishers averaged 1.79 stops in 2025. Across all drivers there were 4.63 stops per 100 laps in 2011 and 2.40 in 2018.

Finishers by number of pit stops

Percent of classified finishers each season

A Formula 1 car at speed over a kerb, the grandstands behind it blurred by the camera's panning.

Eras

How the sport changed across 31 seasons and five sets of rules.

The field closed to within 1.5% in 2023, and the 2026 rules more than doubled the gap

Taking each team's median pace gap over a season, the distance from the fastest team to the slowest was 4.03% of a lap in 1996. It peaked at 5.75% in 2004 and was back at 5.40% in 2010, when three new teams joined at the back. By 2023 it was 1.49%, and it stayed under 1.7% through 2025 (1.63%). Only 2009 was closer, at 1.18%.

Stable rules let slower teams catch up, and new rules undo it. The 2026 regulations brought new cars and engines, and through the first 15 races the spread is back to 3.60%, with Mercedes fastest and Cadillac, a new team, slowest.

Gap from the fastest team to the slowest

Difference in median pace gap, percent of lap time

Teams with fewer than 500 green laps in a season are left out.

In 22 of 31 seasons, one team led more than half of all laps

Dominance is the normal state of Formula 1. In 22 seasons the leading team's cars were in front for more than half of the laps raced. The most one-sided season was 2023, when Red Bull led 86.7% of laps and Max Verstappen alone led 75.7%. Mercedes came close in 2014 with 86.3%.

The most open seasons had a leading share under 40%: 36.4% in 2012, 37.6% in 2003 and 38.9% in 2024. So far in 2026, Mercedes has led 65.2% of laps.

Share of laps led by each season's leading team

Percent of all laps led that season

Cars break down a tenth as often as they did in 1996

In 1996 there were 6.24 mechanical retirements for every 1,000 laps raced. In 2025 there were 0.60, and the lowest season on record is 2024 at 0.53. Retirements from accidents fell too, from 3.67 to 0.90 per 1,000 laps, but by less, so from 2023 to 2025 crashes ended more races than failures did.

New technology still costs reliability. The mechanical rate rose from 1.36 to 2.38 when hybrid engines arrived in 2014, and the 2026 engines have pushed it to 2.50 through 15 races, the highest since 2017 (2.81).

Retirements per 1,000 laps raced

By cause, each season

Cars that retired before completing a lap have no lap row and are not counted.

A driver in orange race overalls lifts a trophy on the podium.

Prediction

What can be known before the lights go out.

The pole-sitter leads 55% of all laps

Across 35,546 laps of racing, the leader was the driver who started on pole 55.0% of the time and one of the two front-row starters 76.4% of the time. Drivers who started 11th or lower led 1.6%.

Pole has become more valuable, not less. The pole-sitter's share of laps led was 50.3% in 1996 to 2005 and 60.0% in 2022 to 2025. That is the starting point for the next finding: any prediction model has to beat the grid.

Share of laps led, by where the leader started

Percent of all laps led, 1996 to 2026

Qualifying already says who will be on the podium. Recent form sharpens the odds but not the picks.

I built a model to predict podium finishes from information available before the start: grid slot, the driver's and team's pace over the previous five races, the driver's recent finishing positions, and the grid gap to their teammate. It is tested the way it would be used. For each season from 2012 to 2026 it is trained only on earlier seasons, then scored on that season: 306 races and 6,146 driver starts it never saw.

Picking the three cars with the highest predicted chance in each race, the gradient boosting model gets 68.8% of podium places right. A baseline that knows only each grid slot's historical podium rate gets 68.0%. The model's probabilities are better, with a log loss of 0.214 against 0.241 (11.2% lower), and they are well calibrated, as the chart shows. But it does not pick winners better: its top pick wins 53.3% of races, and the pole-sitter wins 54.7%.

Predicted chance of a podium against what happened

Test seasons only, driver starts grouped into ten equal bins by predicted chance

Points on the diagonal mean the predicted chance matched the real rate.

ModelPodium picks correctTop pick winsLog lossBrier scoreAUC

Data and methods

Where the data comes from

The source is the public repository TracingInsights/RaceData on GitHub, released under the CC0 public-domain licence. It packages the Ergast and Jolpica Formula 1 database together with tables of safety car periods. I used the version dated 27 September 2026, which runs through the Azerbaijan Grand Prix, 2026-09-26 (round 15 of the 2026 season). The unchanged source files are in data/raw, and scripts/build_dataset.py turns them into the one file both pages use, data/laps.csv.gz.

What one row is

One row is one lap by one driver in one race. The file has 632,937 rows and 20 columns. The time columns are the race date and the season (31 seasons). The group columns are the driver (147) and the team (45). The other columns are the round, Grand Prix, circuit, rules era, grid slot, finishing position, result class, lap number, position at the end of the lap, lap time, lap type, stint number, laps since the last stop, pit-lane time, pace gap and a retirement flag.

Rows dropped

  • Seasons before 1996. Lap records in earlier seasons are less complete and pit stops are only recorded from 1994, so the data starts where coverage is consistent. Nothing else is removed from the file.
  • Each calculation then uses the lap types it needs. There are 547,179 green laps. The rest are the first lap of each race (9,289), laps into the pits (21,283) and out of them (20,289), laps behind the safety car (29,659) or virtual safety car (4,032), and laps where the car was stopped, mostly under red flags (1,206, any lap more than twice the race's median lap time).
  • A driver who retires before finishing the first lap has no lap row, so those starts are missing from every figure.

How each figure is computed

  • Pace gap. For a green lap, the lap time divided by the median lap time of all cars on a green lap on that same lap of that race, minus one, as a percent. Negative is faster than the field. It needs at least five green cars on the lap, which leaves 546,849 laps with a value. Comparing within the same lap removes fuel load, weather and track conditions.
  • Median pace gap of a driver, team or season is the median of those lap values. A driver's race pace is their median pace gap in one race, used only if they have at least 10 green laps.
  • Car, driver and noise shares. Total variance is the variance of race pace across cars within a race, averaged over races. Half the mean squared gap between teammates is the variance not caused by the car. Within each pair of teammates in a season, half the variance of their gap around its season average is race-to-race noise. Car is total minus the teammate part, driver is the teammate part minus noise.
  • Driver ratings. Least squares on teammate gaps (gap equals one driver's rating minus the other's) with a ridge penalty of 5.82, the ratio of noise variance to driver variance from the split above. Intervals come from re-sampling whole races 300 times.
  • Fuel and tyre effects. A regression of log lap time on race lap number and laps since the last stop, with a separate baseline for each driver in each race. It uses green laps from 2010 on, within 5% of the driver's median lap that race, for drivers who stopped at least once. Standard errors are clustered by race.
  • Undercut and overcut. Pairs of cars in consecutive positions with the second car no more than three seconds behind, using gaps built by adding up lap times. One pits, the other pits one to three laps later, and the pair is scored one lap after the second stop. Any pair that touches a safety car lap is left out. The rate is the percent of pairs in which the car that started behind is ahead.
  • Pit stops per 100 laps is pit-in laps divided by all laps, times 100. Stops per finisher counts pit-in laps for drivers classified as finished or lapped.
  • Field spread is the slowest team's median pace gap minus the fastest team's, for teams with at least 500 green laps in the season.
  • Share of laps led is laps completed in first position by a driver, team or grid slot, divided by all laps completed in first position in the same seasons.
  • Retirements per 1,000 laps is the number of drivers whose last lap ended in a retirement of that kind, divided by all laps raced, times 1,000. Mechanical covers engine, gearbox, hydraulics and similar failures. Accident covers accidents, collisions, spins, damage and punctures.
  • Podium model. Form figures use only the five races before the one being predicted. The baseline is each grid slot's podium rate in the training seasons. Log loss and Brier score measure how good the probabilities are (lower is better). AUC measures how well the model ranks podium finishers above the rest.

Reproducing the numbers

Running python scripts/build_dataset.py then python scripts/analysis.py rebuilds the data file and every number on this page into data/findings.json, which the charts read. python scripts/fill_report.py --check confirms that every number in the text matches that file. The dashboard computes its figures in the browser from the same data/laps.csv.gz, using the same definitions of pace gap, laps led, pit stops and retirements.

A Formula 1 car seen from behind, driving away down a wet road at dusk with its red rain light on.

That's the lap.

Now take the data out yourself: filter by season, driver, team or circuit and watch the numbers move.

Open the dashboard